


B2B Paid Media Benchmarks for 2026
Most B2B paid media benchmarks are useless.
They come from platform surveys with self-reported data, or from agencies that aggregate thousands of accounts across industries and call the average meaningful. They'll tell you the "average cost per lead on LinkedIn is $150" without telling you whether that lead ever turned into pipeline, or whether it was a downloaded eBook that went straight to the recycling bin.
We're publishing something different: actual pipeline data from real B2B campaigns we managed between July 2024 and October 2025. Three clients across two verticals--B2B professional services and B2B tech/media--totaling $180K+ in ad spend across Google Ads and LinkedIn Ads.
Every number is CRM-validated. Pipeline means Salesforce or HubSpot opportunities, not MQLs. Closed-won means signed contracts, not "marketing-influenced revenue."
The sample is small. We're not pretending otherwise. But the data is specific, transparent, and tied to actual business outcomes. Which is more than most published benchmarks can say.
Methodology
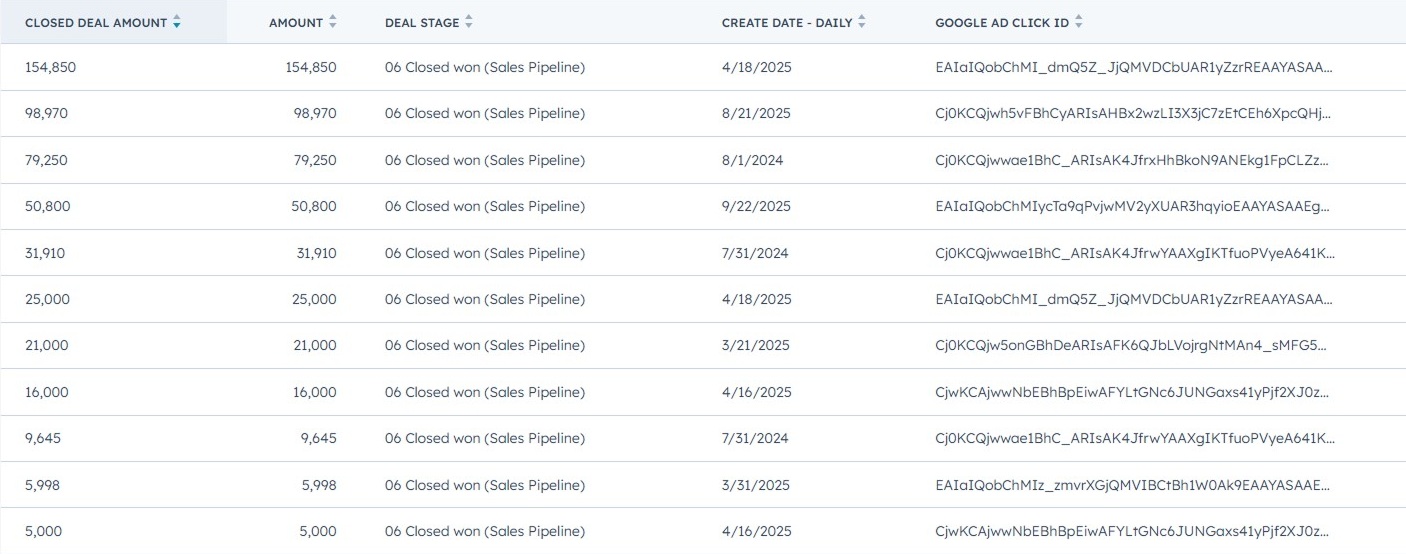
All data comes from campaigns Osric Digital managed directly. Client names are anonymized per our standard policy, but all metrics are CRM-validated through Salesforce or HubSpot deal-stage integrations. We use GCLID tracking and first-party data imports to tie ad spend directly to pipeline and closed-won revenue, not last-click attribution models or platform-reported conversions.
When we say "conversion," we mean a form fill or phone call from a qualified prospect. When we say "pipeline," we mean a deal stage in CRM with a dollar value attached. When we say "closed-won," we mean a signed contract.
The three engagements:
- Client A is specialized advisory firm running Google Ads only. The period covered is 15 months (July 2024–October 2025). $89,777 in ad spend. Deal sizes range from $50K–$400K, which matters because it drives up CPCs and lengthens the feedback loop between click and closed-won.
- Client B is a B2B creative studio selling to enterprise marketing teams. They ran Google Ads + LinkedIn Ads simultaneously. Google: 6 months (January–June 2025), $9,937 in spend. LinkedIn: 7 months (January–July 2025), $21,460 in spend. This is the only engagement covered here where we can do a clean head-to-head channel comparison.
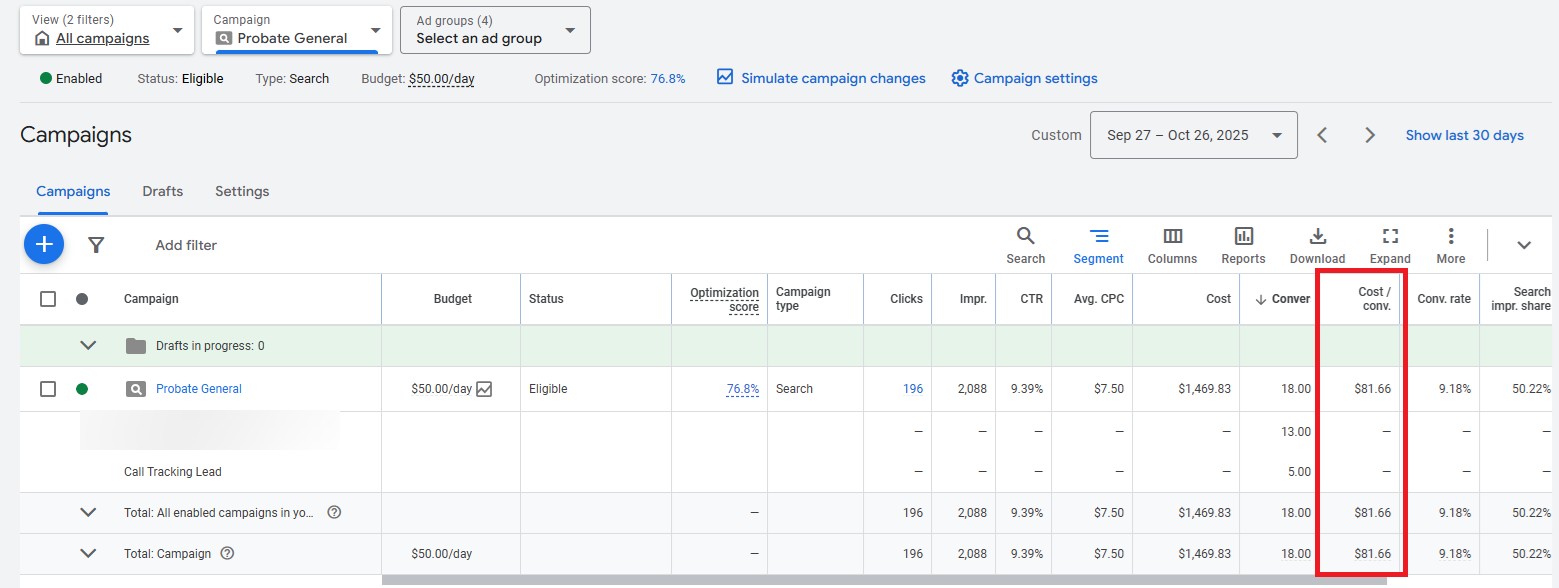
- Client C is a specialized law firm. Google Ads only. 7 months (April–October 2025). Scaled from $600/month to $1,500/month. This was a turnaround, meaning that we inherited an account where nearly every lead was spam.
Google Ads Benchmarks for B2B Services
The headline numbers

What actually drives these numbers
The spread between Client A ($300 cost per conversion) and Client B ($144) comes down to auction dynamics. Client A operates in a high-CPC vertical. The consulting firm's core keywords run $15–$20 per click because the deal sizes are $50K–$400K. Client B targets B2B creative production keywords where CPCs are lower because fewer advertisers compete for that space.
Client C is a different animal entirely. This was a turnaround engagement. When we took over, the account was generating leads at $69 each, but nearly all were spam from Google's Search Partner Network and Display placements. After excluding junk networks, cutting 69 of 79 keywords, and implementing call tracking, cost per qualified lead initially spiked to $300 before optimization brought it down to $82. The real benchmark isn't the $82. It's the fact that the account went from ~0% lead quality to 90%+ lead quality.
Funnel conversion rates (Google Ads)
This is the data nobody else publishes:
The conversion rate from click to form fill was remarkably consistent at ~5% across both B2B services clients, despite different verticals and price points. This aligns with what we see as a stable baseline for well-structured Google Ads campaigns targeting commercial-intent keywords in B2B.
The real divergence happens post-conversion. Client B's higher opportunity rate (23% vs. 17%) reflects the precision of a negative keyword strategy, with 814 negatives filtering out irrelevant traffic before it ever reached the landing page. Client A's lower rate reflects a broader keyword set across multiple service lines where not every inquiry was a fit.
Negative keywords: the unsexy lever that matters most
Client B's 814-keyword negative list is the single biggest driver of that 58x pipeline-to-spend ratio. In B2B Google Ads, the gap between a mediocre campaign and a high-performing one usually isn't the keywords you bid on. It's the keywords you exclude.
For context: most accounts we audit have fewer than 50 negative keywords. Many have zero. This is the equivalent of running a trade show booth with no qualifying questions. You'll talk to everyone, close nobody.
LinkedIn Ads Benchmarks for B2B (ABM)
Campaign-level breakdown
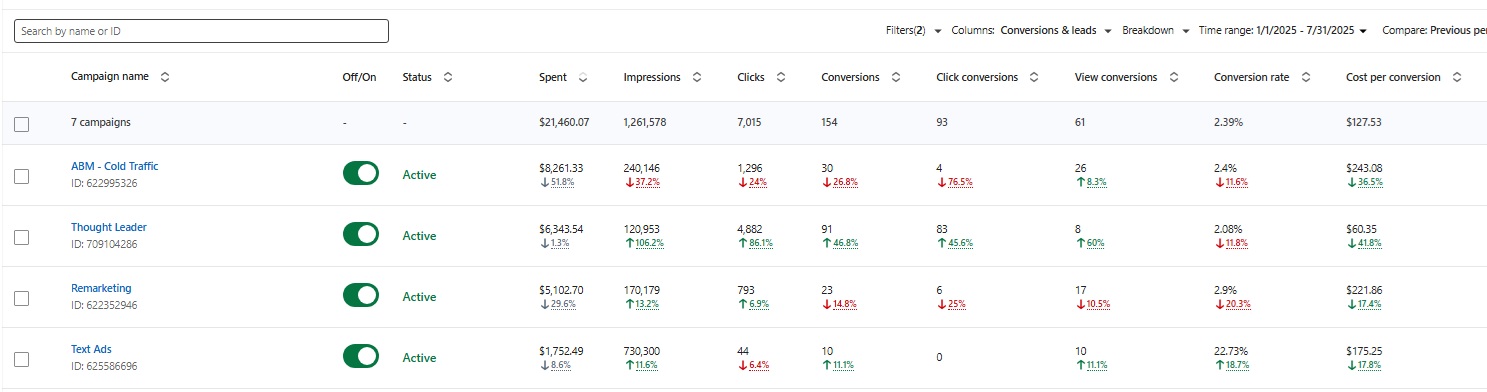
Client B ran LinkedIn Ads as a demand generation layer on top of Google Ads demand capture. The structure was account-based marketing with uploaded company lists targeting enterprise tech buyers.
The Thought Leader Ads finding
This is the single most significant data point in this entire report: Thought Leader Ads drove 53% of all conversions on 30% of total spend, at $70 per conversion, or roughly half the cost of ABM cold traffic.
We used the client's founder as the face of the campaign. The creative was organic-style LinkedIn posts promoted to the target account list, not gated whitepapers or lead gen forms. Just the founder talking about the problems their buyers face.
The vast majority of conversions came from direct brand engagement, such as site visits, contact form fills, and quote requests, rather than content downloads.
Full-funnel LinkedIn numbers
The cost per Salesforce lead ($1,651) will look expensive if you're used to measuring LinkedIn by cost per click or cost per "lead" from a lead gen form. But the relevant comparison isn't $1,651 vs. a $50 eBook download. It's $1,651 to get a qualified enterprise buyer into your CRM vs. whatever your SDR team's fully loaded cost per qualified meeting is.
The compounding effect
Pipeline wasn't linear. The first four months produced modest results. Then June generated $80K in pipeline and July produced $190K, together accounting for 65% of total pipeline from LinkedIn. ABM compounds: you build frequency and recognition with the account list, and deals break loose in clusters, not steadily.
This is critical for anyone evaluating LinkedIn Ads ROI on a 30- or 60-day window. You'd have killed this campaign in month two. By month seven, it was generating $190K pipeline months.
Google Ads vs. LinkedIn Ads: Head-to-Head
Client B is the only engagement where we ran both channels simultaneously for the same company, making it the cleanest comparison in our dataset.
Google Ads was more efficient on a cost-per-opportunity basis by roughly 4x. But that comparison misses the point.
Google Ads captures existing demand, the people already searching for what you sell. LinkedIn Ads generates demand by getting you in front of people who aren't searching yet but match your ICP. You can't scale Google Ads beyond the available search volume. You can scale LinkedIn Ads to any audience size you can define.
The right framework isn't "which channel has better ROAS." It's "am I capturing all available demand first (Google), then generating new demand on top (LinkedIn)?" For Client B, the answer was both, and the combined pipeline across channels was just under $1M on $31K in total spend.
What These Numbers Mean for Your Planning
If you're a B2B company spending $10K–$100K per month on paid media, here's what we'd calibrate expectations around based on this data:
Google Ads for B2B services: Expect $100–$300 cost per conversion depending on your vertical's CPC dynamics. Plan for a 5% click-to-conversion rate on commercial keywords with proper negative keyword management. Budget for 3–6 months before the CRM data is statistically meaningful. Pipeline-to-spend ratios of 10x–60x are achievable but depend heavily on your deal sizes and sales cycle efficiency.
LinkedIn Ads for B2B ABM: Expect $1,000–$2,000 cost per qualified CRM lead. CPC and CPM will be high due to the highly targeted list, but keep the emphasis on impressions and engagements with your ICP buyers to keep management happy. Plan for 4–6 months before the compounding effect kicks in and you start to see opps in your CRM, although it can happen much faster (especially when combined with other channels). Thought Leader Ads should be a major component of your LinkedIn strategy because they consistently outperform standard sponsored content in our data.
Cross-channel: If you're only running one channel, start with Google Ads for demand capture. Layer LinkedIn on once you've maxed out your Google Ads opportunity set and have the budget to invest in a 6-month ABM build. Use Google Ads traffic to seed your LinkedIn remarketing audiences.
About This Data
This report covers three client engagements managed by Osric Digital between July 2024 and October 2025. Osric Digital is a B2B paid media agency specializing in B2B tech and complex services.
Total managed spend across all engagements discussed here was approximately $180,000. All pipeline and revenue figures are validated through CRM systems (Salesforce and HubSpot) using GCLID tracking and first-party data imports. Client names are anonymized. The data set is small and should be treated as directional, not definitive. Certain verticals like fintech are likely to have higher CPAs. We plan to update these benchmarks annually as our data set grows.
If you have questions about the methodology or want to discuss how these benchmarks compare to your own campaigns, reach out.